
- Month
- Current standing
- Bodies with a score
- 39 of 44
- Median score
- 20/100
US state and local government websites,measured every month.
Automated accessibility figures for the 44 cities, counties, states, transit agencies and public universities on our list, all bound by the ADA Title II web rule. Free to quote.
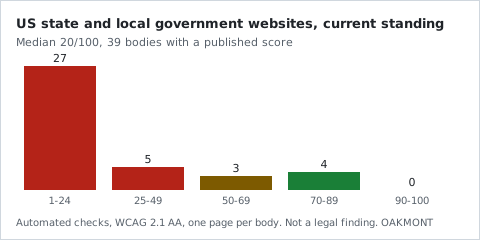
In Current standing, 35 of the 39 US state and local government websites with a published score came in below 70 out of 100. The median was 20.
70 is our own reference point, not a legal threshold.
No monthly snapshot has been written yet, so these figures are the current state of the index rather than a closed month.
The two compliance dates
- State and local governments with 50,000 people or more
- April 26, 2027
- Smaller governments and special districts
- April 26, 2028
28 CFR Part 35, final rule of 24 April 2024; compliance date extended by the interim final rule of 20 April 2026 (91 FR 20902)
Totals
- Bodies on the list
- 44
- Measured this period
- 39
- With a published score
- 39
- Not measured this period
- 5
How the scores are spread
| Score | Bodies |
|---|---|
| 1-24 | 27 |
| 25-49 | 5 |
| 50-69 | 3 |
| 70-89 | 4 |
| 90-100 | 0 |
By kind of body
| Kind | With a score | Median | Below 70 |
|---|---|---|---|
| city governments | 19 | 18 | 17 |
| government bodies | 13 | 20 | 12 |
A kind with fewer than 5 scored bodies is not shown, and where one small kind could be worked out from the others, the next smallest is left out too.
Most common failures
Share of the 39 scored bodies with stored findings for this period where the check failed at least once.
| Failure | Bodies | Share of bodies |
|---|---|---|
| 1.3.1 Info and Relationships | 34 | 87% |
| 4.1.2 Name, Role, Value | 30 | 77% |
| 2.4.7 Focus Visible | 26 | 67% |
| 2.4.4 Link Purpose (In Context) | 21 | 54% |
| 2.4.1 Bypass Blocks | 20 | 51% |
Five highest scores
| Body | Score |
|---|---|
| State of Illinois | 89/100 |
| Portland | 87/100 |
| Minneapolis | 79/100 |
| University of California, Berkeley | 71/100 |
| San Diego | 63/100 |
Five lowest scores
| Body | Score |
|---|---|
| Phoenix | 1/100 |
| Chicago Transit Authority | 4/100 |
| Boston | 6/100 |
| Ohio State University | 6/100 |
| Baltimore | 7/100 |
Every body on the list
Each name links to its own page in the index, with the score history, the page we measured and the form to object or ask for a new measurement.
- Austin20/100
- Baltimore7/100
- Boston6/100
- Chicago Transit Authority4/100
- Cook County13/100
- Dallas23/100
- Denver51/100
- Detroit40/100
- Harris County19/100
- Houston7/100
- Indianapolis18/100
- King County15/100
- LA Metro17/100
- Las Vegas8/100
- Los Angeles County9/100
- Miami-Dade County20/100
- Minneapolis79/100
- Nashville12/100
- New Orleans7/100
- New York City37/100
- New York Public Library23/100
- Ohio State University6/100
- Philadelphia8/100
- Phoenix1/100
- Portland87/100
- San Diego63/100
- San Francisco28/100
- Seattle12/100
- State of California48/100
- State of Florida8/100
- State of Georgia53/100
- State of Illinois89/100
- State of Pennsylvania21/100
- State of Texas22/100
- State of Washington9/100
- Travis County37/100
- University of California, Berkeley71/100
- University of Florida23/100
- University of Texas at Austin21/100
Method and limits
- Standard
- WCAG 2.1 Level AA
- Scope
- One page per entity: the main public entry point a citizen lands on.
- Frequency
- Weekly re-measurement; the published index is the latest sweep.
Each month's figures come from the snapshot written on the first day of the next month: the latest score each body had at that point. Findings are the newest stored for each body within the month.
- These are automated checks only. No person tested these sites, and no assistive technology was used.
- A low score is not a legal finding. It does not say whether a body meets the ADA Title II rule.
- We chose the list. It is not a random sample, so the figures do not speak for every state or local government in the country.
- One page per body, the main entry point. A good home page says nothing about the forms and documents behind it.
- OAKMONT sells accessibility scanning and repair services. This report is our own work and has not been reviewed by an outside party.
For press
Quote any figure on this page with a link back. Questions about the numbers, the method or one body on the list go to:
Oakmont Technologies LLC, 5511 Parkcrest Dr. Suite 103, Austin, TX 78731, United States
Data
How to cite
Oakmont Technologies LLC, "Accessibility of US state and local government websites", Current standing, https://oakmonttechnologies.com/ranking/us-report
Embed the chart
The chart below updates with each month. Paste this where you want it:
<a href="https://oakmonttechnologies.com/ranking/us-report"><img src="https://oakmonttechnologies.com/api/public/ranking/us-report.svg" width="480" height="240" alt="Accessibility scores of US state and local government websites, by range"></a>
Zmierz to na własnej stronie.
Darmowy skan czyta stronę tak, jak opisuje to ten rejestr, wskazuje, co nie przechodzi, i przy każdym błędzie podaje kryterium.
Bez konta. Jedna strona, około dwudziestu sekund.